
Introduction: A Familiar Pattern on D-Street
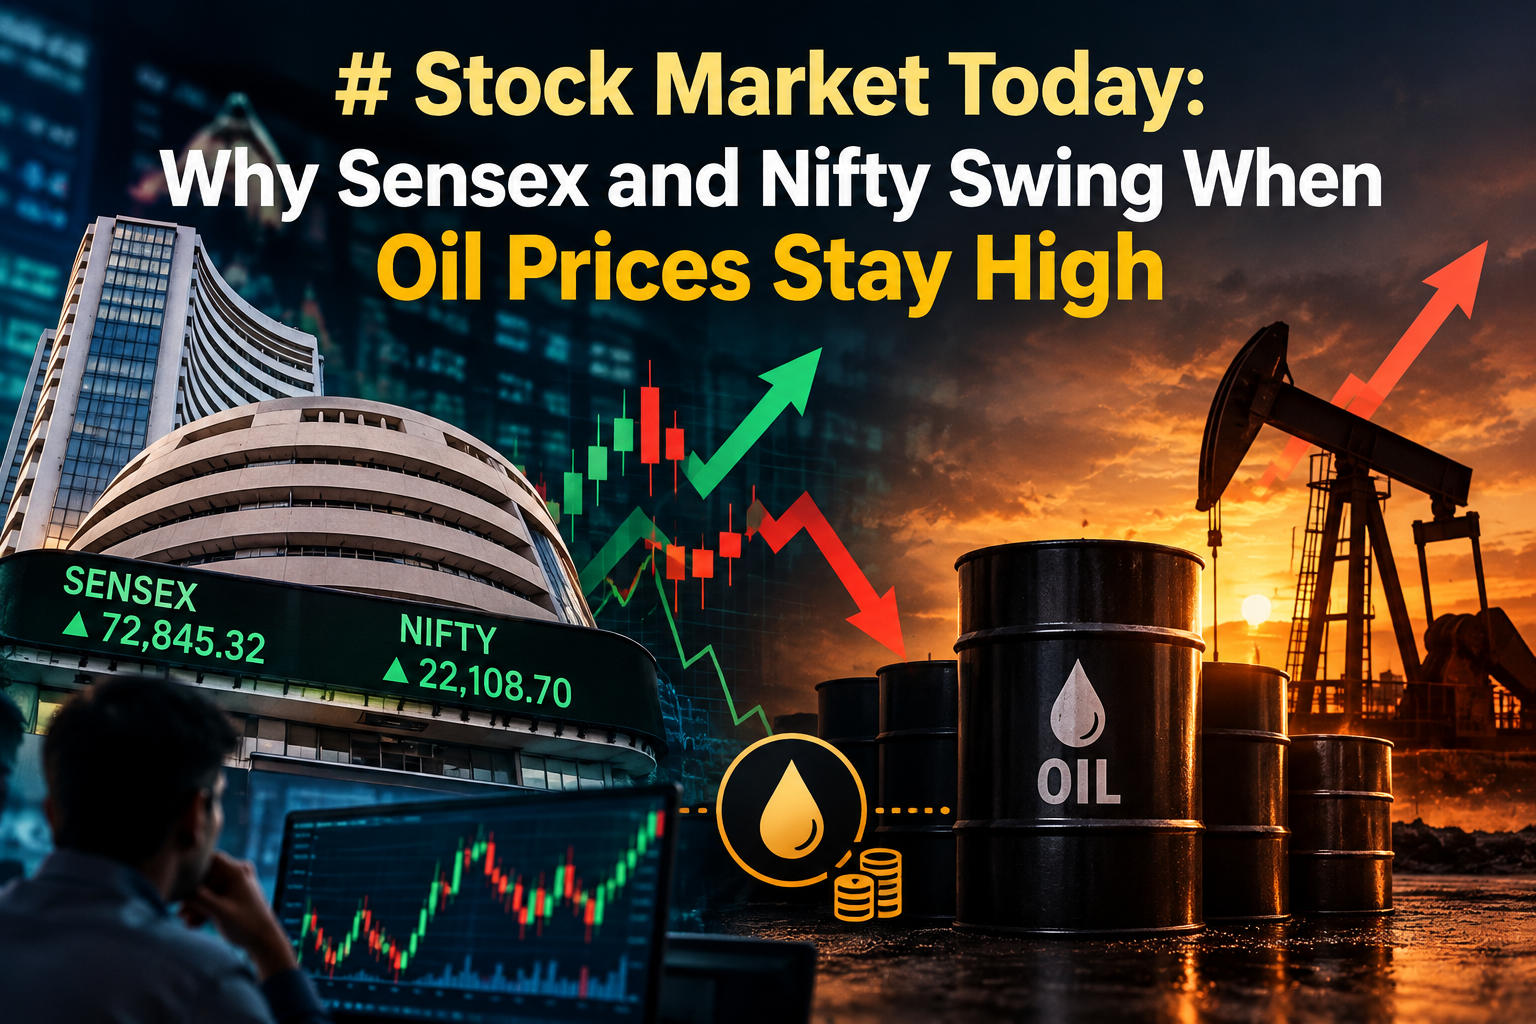
If you’ve followed Indian markets for any length of time, you’ve seen this headline pattern before: Sensex swinging between gains and losses, Nifty50 struggling to hold a key level, and crude oil prices staying stubbornly above $100 a barrel.
This isn’t a coincidence. Oil price movements are one of the most closely watched macro triggers for Indian equities and understanding why can help investors make sense of days when the market seems directionless.
1. Why Crude Oil Prices Matter So Much to Indian Markets
India imports over 80% of its crude oil requirement, which makes the country’s economy and by extension, its stock market highly sensitive to global oil price swings.
When oil stays above the $100 mark for an extended period, it triggers a chain reaction:
- Higher import bill → Widens India’s current account deficit (CAD)
- Weaker rupee → A costlier import bill puts pressure on the currency, making imports even more expensive
- Inflation risk → Fuel costs feed into transportation, logistics, and manufacturing costs across the economy
- RBI policy pressure → Persistent inflation can force the central bank to keep interest rates higher for longer, which weighs on equity valuations
This is why, on days when crude stays elevated, sectors like paints, tyres, aviation, and FMCG (all oil-sensitive input costs) tend to underperform, while oil marketing companies (OMCs) and upstream oil producers sometimes see mixed or even positive reactions depending on how the price pass-through works.
2. Why Nifty50 Struggles Near Key Support/Resistance Levels
When headlines mention “Nifty50 below 23,450” or a similar round-number level, it usually reflects a psychological support/resistance zone that traders watch closely.
A few dynamics typically play out around such levels:
- Profit booking by short-term traders once the index of nifty approaches resistance
- Bargain buying by long-term investors once it nears a support zone
- Increased options activity, with heavy Call and Put writing around round figures, which can act like a magnet or a ceiling for the index
- FII/DII tug-of-war — Foreign Institutional Investors often turn cautious during high oil/high inflation phases, while Domestic Institutional Investors continue steady buying, leading to a push-pull effect that shows up as range-bound, “swinging” trade
3. What “Sensex Swings Between Gains and Losses” Really Means
A day where the Sensex oscillates between green and red multiple times usually signals market indecision. This typically happens when:
- Global cues are mixed (e.g., US markets closed higher, but Asian markets are weak)
- A major economic data point (inflation, GDP, Fed commentary) is due and investors are waiting on the sidelines
- Sector-specific news is offsetting broader index-level sentiment (for example, strong IT earnings offsetting weak energy stocks)
- Crude oil and currency movements are adding uncertainty to input-cost assumptions for India Inc.
In such phases, volatility indices like India VIX often see a mild uptick, reflecting the market’s on the basis of nifty 50 temporary lack of conviction.
4. How Should Investors Read Days Like This?
Rather than reacting to every intraday swing, here’s how seasoned investors typically approach such sessions:
- Watch sector rotation, not just the index OR nifty 50 — money often moves from oil-sensitive sectors into defensives like IT, pharma, or FMCG (or vice versa) rather than leaving the market entirely
- Track the rupee-oil correlation — a stable rupee despite high oil prices is often a sign of resilient capital inflows
- Avoid overreacting to single-day volatility — range-bound days are common ahead of major data releases or global central bank decisions
- Focus on fundamentals over headlines — a company’s earnings quality matters more over the long term than a single day’s index move
Conclusion: Volatility Is Information, Not Just Noise
Days when the Sensex swings and Nifty 50 hovers near a key level while oil stays elevated aren’t random they reflect a market processing real economic signals: import costs, currency pressure, inflation expectations, and global cues, all at once.
For investors, the key takeaway isn’t to chase every intraday move, but to understand why the market is behaving this way and to use that context to make informed, long-term decisions rather than short term, headline-driven ones.
Learn more about our site archive2in.com
Contact us on our email id contactarchive2in@gmail.com
Read out our latest artice on our blog section
Leave a Reply
You must be logged in to post a comment.